

Get Access to 250+ Online Classes
Learn directly from the world’s top investors & entrepreneurs.
Get Started NowIn This Article
Will your favorite stock’s next move be higher or lower?
Is now a good time to buy more shares or start looking for opportunities elsewhere?
How can you be sure?
Momentum.
Momentum is the speed of price changes over time in a stock. It shows the strength of a move, up or down.
Stocks can exhibit bullish momentum (the price is rising) or bearish momentum (the price is falling). Like Isaac Newton’s First Law, stocks trading in a trend tend to stay in that trend.
Determining whether you’re investing with the momentum or against the momentum of your stocks is critical for generating positive returns.
You can do that with something called the “relative strength index”, otherwise known as RSI in stocks.
What is the Relative Strength Index (RSI) in Stocks?
The Relative Strength Index (RSI) is a momentum indicator that measures the magnitude of recent price changes.
J. Welles Wilder Jr., a prolific technical trader, developed the RSI and introduced it in his 1978 book, New Concepts in Technical Trading Systems.
The RSI is an oscillator — a line graph with two extremes — which can have a reading from 0 to 100 based on recent price activity.
The RSI measures momentum and is used to predict trend reversals:
- the end of an uptrend where prices will begin to head lower or
- the end of a downtrend where prices will bounce higher
Interpretations of the Relative Strength Index are that values below 30 indicate an oversold (or undervalued) condition and values over 70 indicate an overbought (or overvalued) condition.
In either case, when the RSI indicator reaches an extreme value, an investor can expect that the current trend is near its conclusion and a price reversal is coming.
This can be a tremendous advantage for stock investors looking to get out of a position near the top or enter a new position near its bottom.
RSI Example
Let’s look at an example of RSI in real-time, using the chart below.
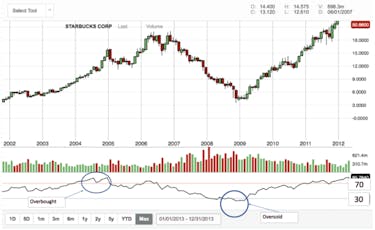
Starbucks’ 10-year chart shows:
- an uptrend from 2002-2007
- a downtrend from 2007-2009
- and another uptrend from there
The RSI flashed an overbought signal towards the end of 2005 and reversed its course shortly thereafter. In the beginning of 2009, the stock became oversold and quickly headed higher.
Pros and Cons of Using the RSI
Like all indicators (and as seen in the example above), the RSI isn’t perfect. Overbought and oversold signals do not perfectly align with actual stock price movements and many reversal signals are false alarms.
Since the indicator measures momentum, a stock can remain overbought or oversold for a long time under certain market conditions.
Trading purely based on RSI signals can lead to losses or selling too early — a disadvantage of using RSI in stocks.
That said, a vast majority of technical traders use the RSI almost exclusively, suggesting its usefulness as a predictive tool.
Keep this in mind: it’s simply an indicator, it’s not prescient.
RSI vs MACD: What’s the Difference?
Another trend-following momentum oscillator, the Moving Average Convergence Divergence (MACD) measures the relationship between two Exponential Moving Averages (EMAs), while the RSI measures price change in relation to recent price highs and lows.
Either indicator may be used to signal an upcoming trend reversal.
The two indicators are often used in conjunction but, because they measure different factors, sometimes give contrary indications.
Keep in mind that stock investors can choose which indicator they prefer or simply decide to use them together.
How to Use the RSI to Your Advantage
According to Wilder Jr., the RSI indicator is at its best when it shows divergence — when the movements of the RSI do not align with the movements in stock price.
Since the RSI indicator shows momentum, divergence means the current move is being supported by fewer and fewer investors, signaling an opportunity for traders to bet on the reversal.
Divergence can be bullish or bearish.
Let’s look at an example of each.
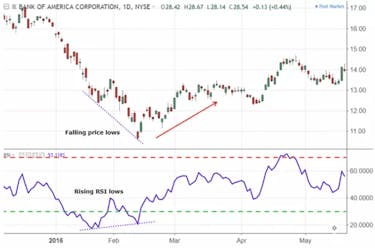
Bullish Divergence
In this next graph, we can see bullish divergence. The stock made lower lows while the RSI made higher lows, signaling positive price action was imminent.
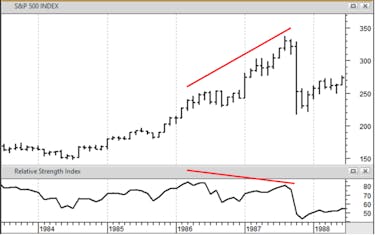
Bearish Divergence
This next chart shows bearish divergence: the S&P made higher highs while the RSI made lower highs, indicating the next move would be lower. The stock fell shortly thereafter.
The Bottom Line: Using RSI to Your Advantage
Stocks trade in trends, known as momentum.
The best investors give themselves the greatest chance of success by investing, or not investing, in the direction of the current momentum.
Understanding how to read and using the RSI indicator as a gauge of momentum will bolster returns and help you avoid taking unnecessary losses.
The RSI indicator is not perfect, but it can provide you with expectations about future price movements and give you the edge you need to be successful on your stock investing journey.